Work Case study
What the cameras already knew
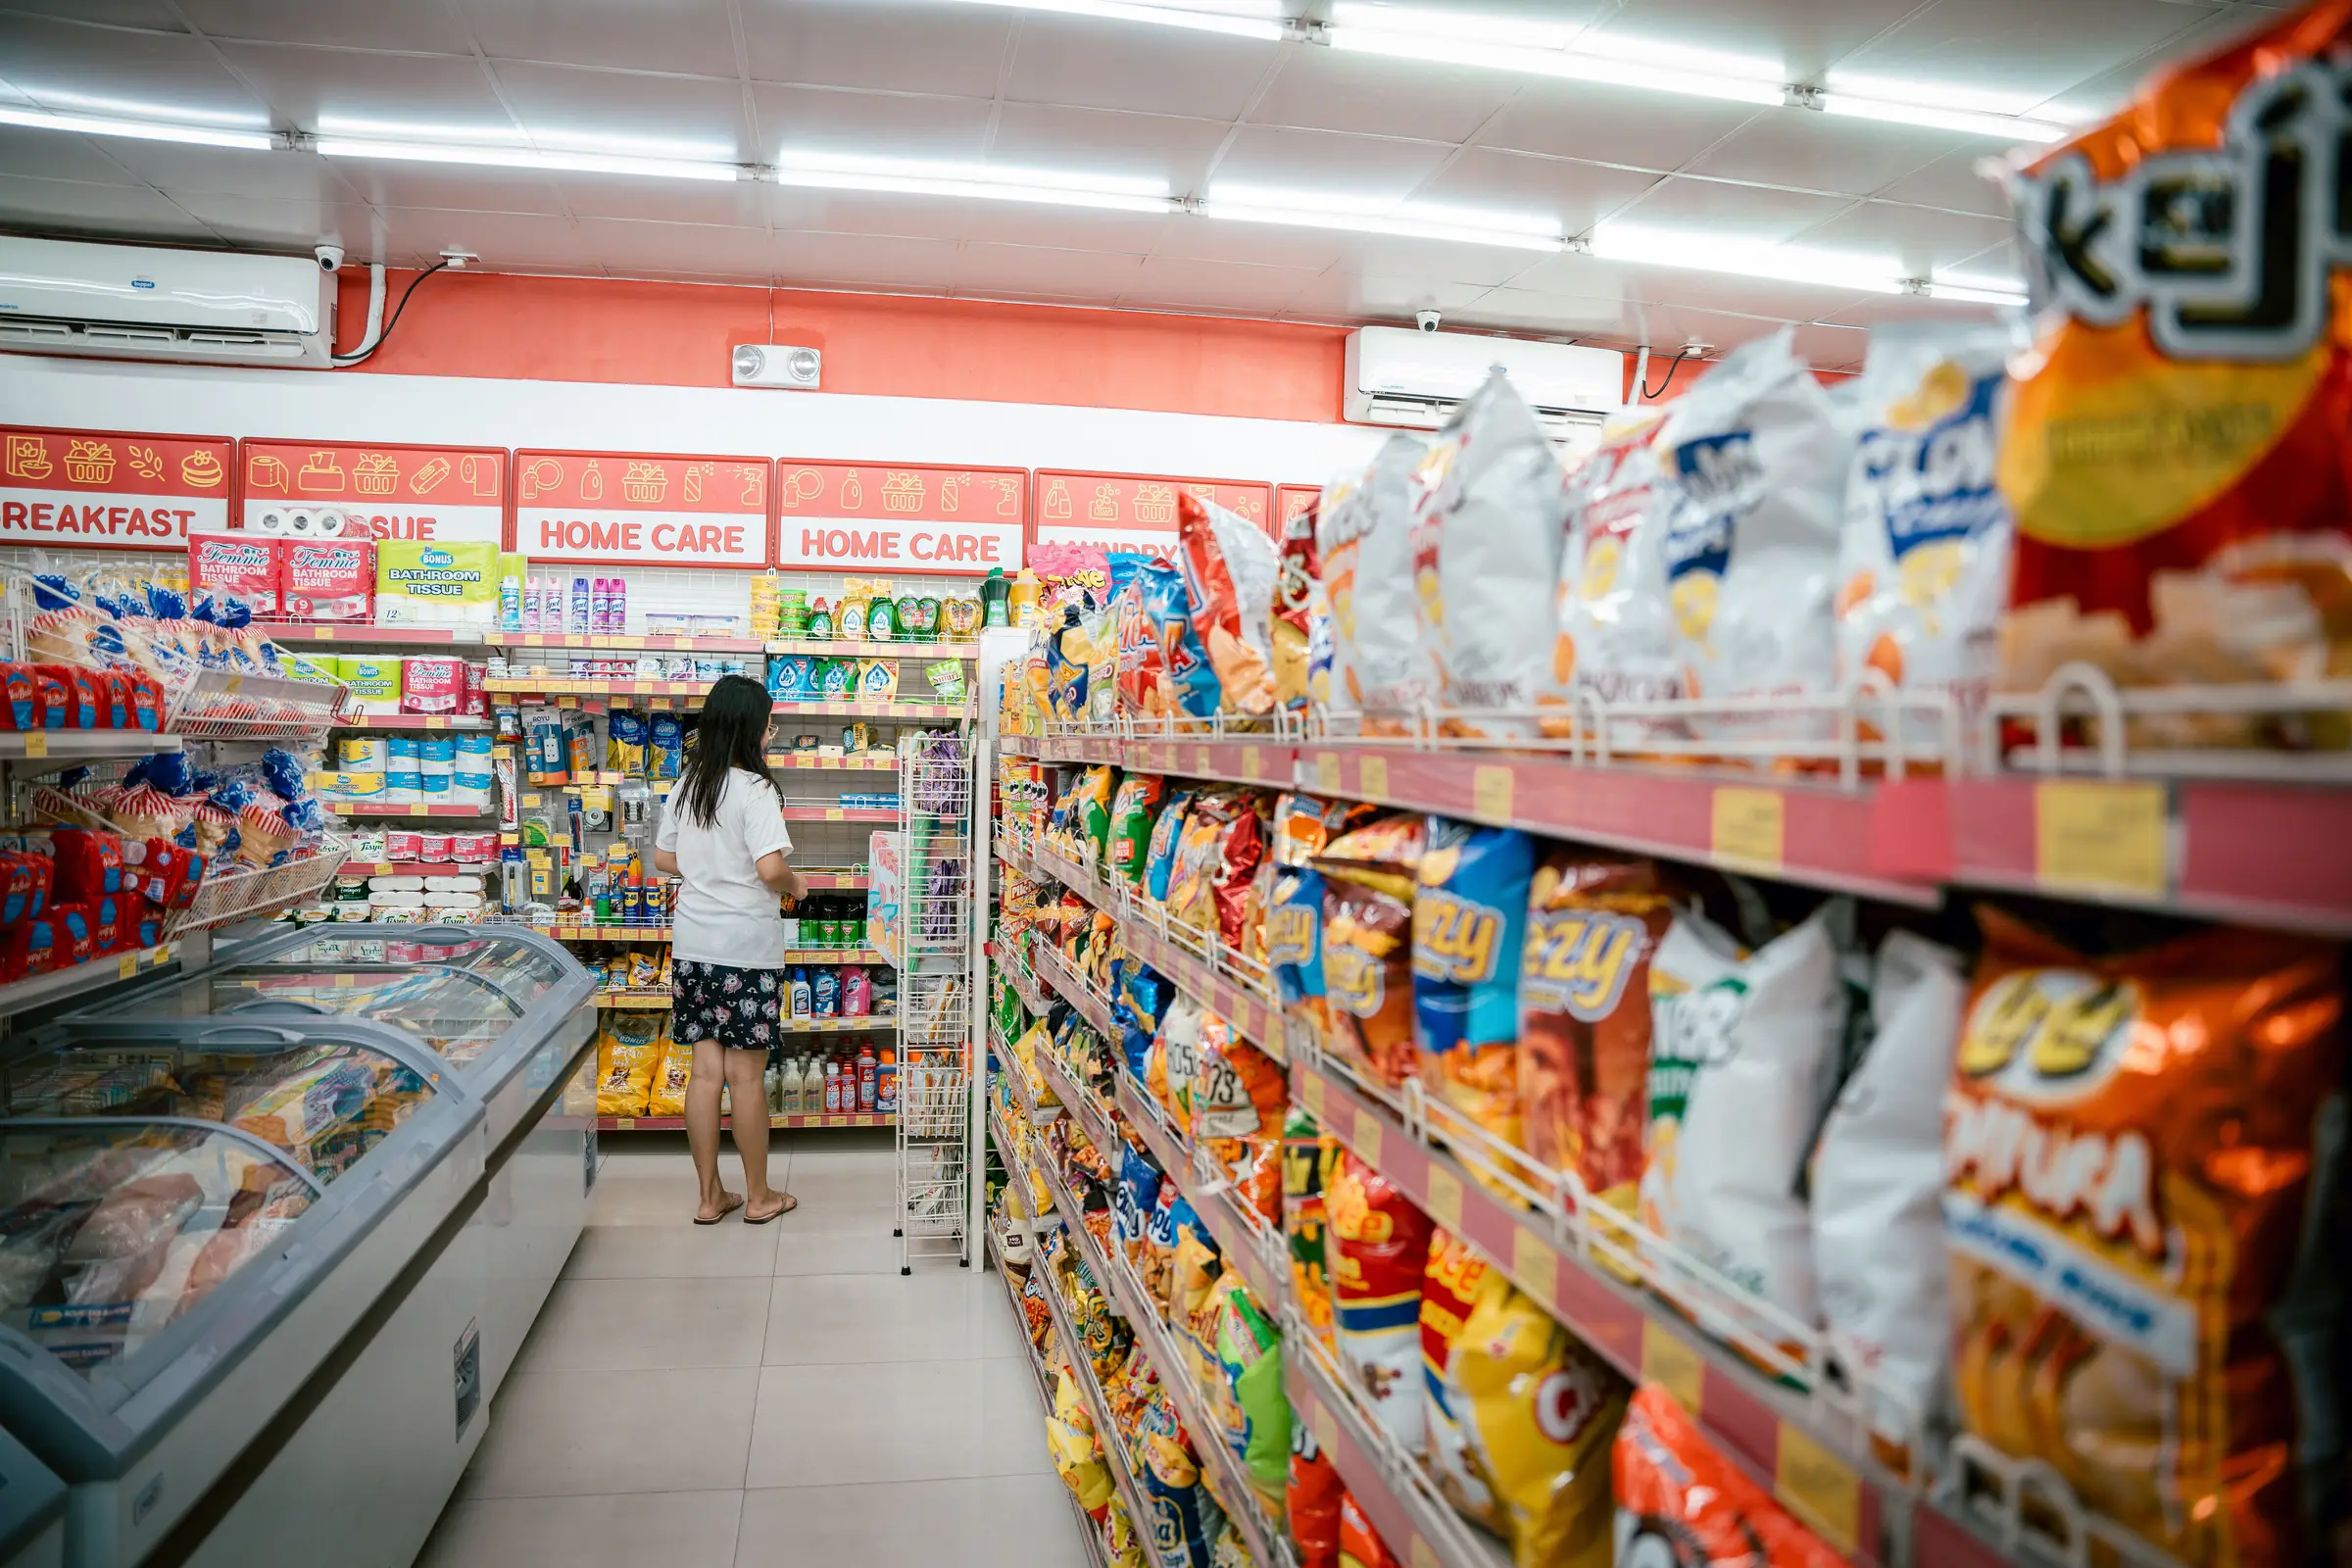
A supermarket was watching stock expire on its shelves. We turned the CCTV it already had into a map of how shoppers really move, and rebuilt the floor around it.
- +3.6 ptsgross margin
- 64%less expired stock
- +29%high-margin sales
- 2.3×shoppers reaching the back
Where they started
Full shelves, slow stock, rising costs
Some lines in the store were barely moving. Biscuits, sauces and personal care products sat on the shelf for so long that a growing share went past its date and had to be written off. Shoppers, meanwhile, struggled to find their way around: staff were answering the same “where is…?” questions all day.
The owner tried the obvious fixes. Brighter lighting over the slow aisles. New signage. Two extra floor assistants to guide people. Each one added cost, and none of them moved the stock. The problem wasn’t visibility. Nobody actually knew how people moved through the store.
- Extra lighting
- New signage
- Two more floor staff
- Expiry write-offs still rising
- Client
- Supermarket, Sri Lanka (name withheld)
- Cameras
- 9 existing CCTV cameras, no new hardware
- Footage analysed
- 1,200+ hours
- Timeline
- 14 weeks to a new layout
Research and development
Teaching CCTV to read a store
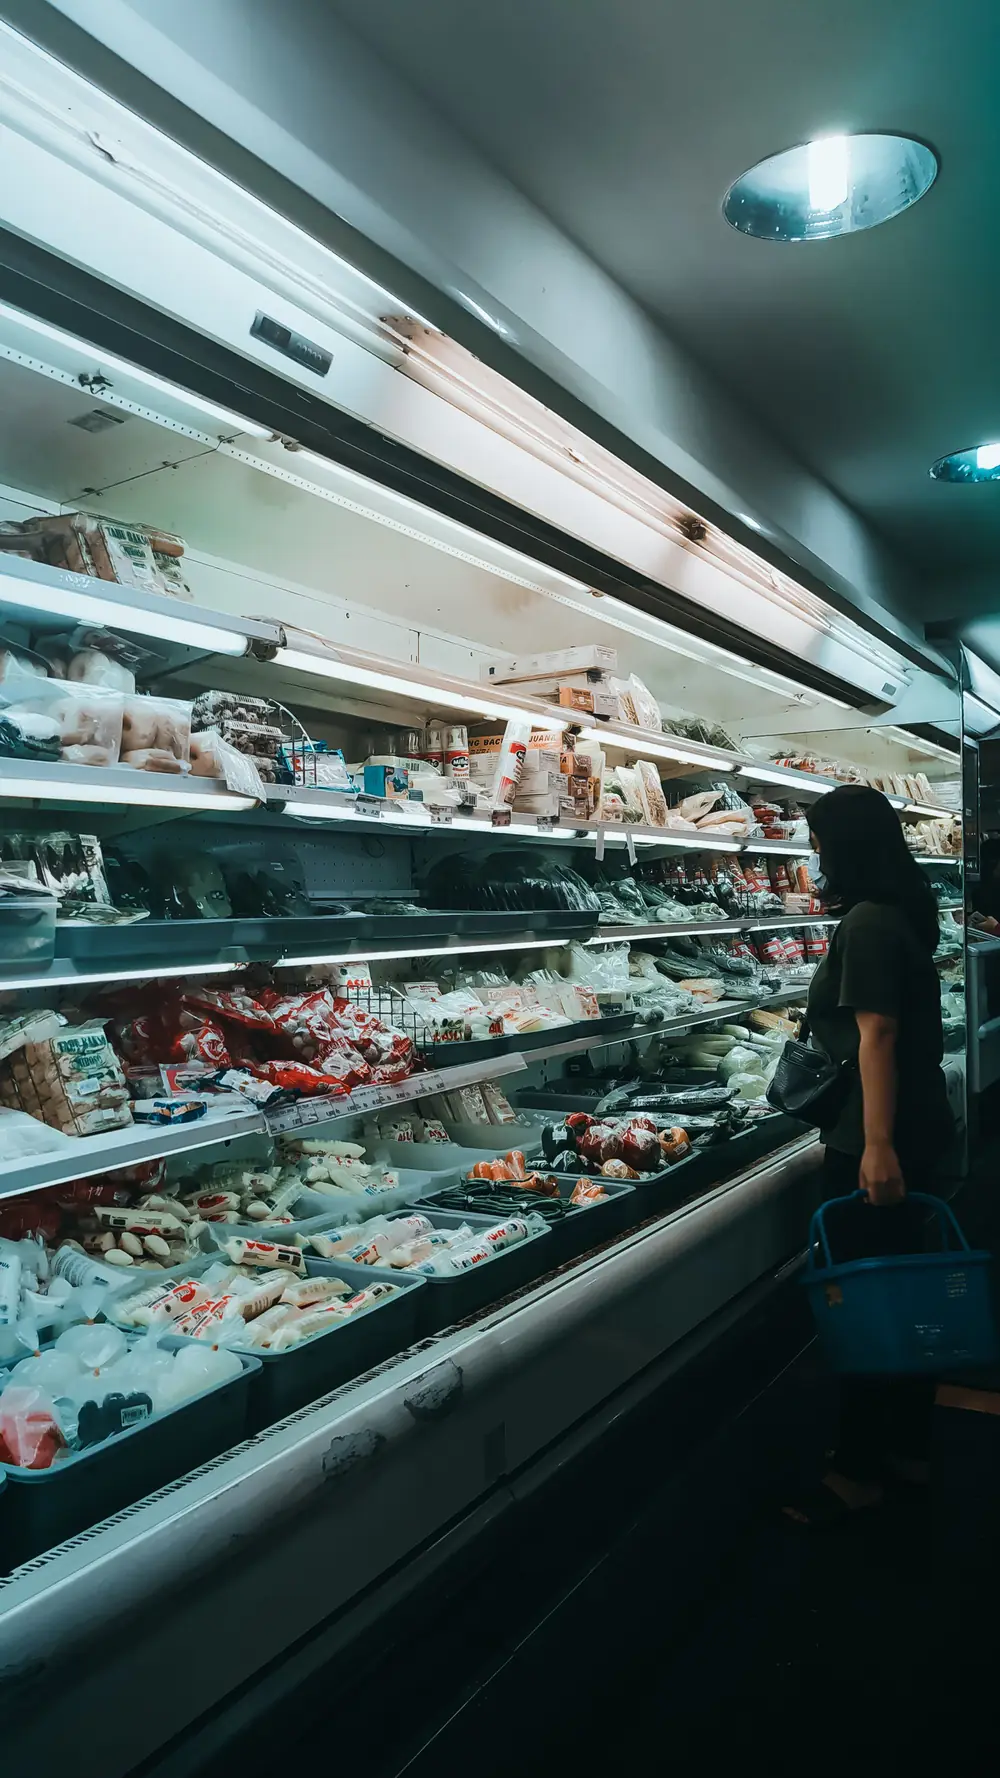
Off-the-shelf people counters only tell you how many came in. We needed to know where they walked, where they stopped, and what they picked up. So we built our own computer vision pipeline and ran it on the cameras the store already had.
-
01
See every shopper
A YOLO person detector3,4, pre-trained on the COCO benchmark5 and tuned for real store footage: fisheye corner cameras, crowded aisles, low evening light. We checked it against manual counts with standard tracking metrics6 until it agreed 94% of the time.
-
02
Follow them through the store
Each shopper keeps the same ID from the door to the till using the ByteTrack algorithm7, so a visit becomes a path, the idea behind landmark supermarket path studies8: which aisles, in what order, how long in each, and where people turned back.
-
03
Touch versus take
We mapped 38 shelf zones and taught the system to tell a reach from a pick-up. Picking a product up and putting it back is a very different signal from putting it in the basket: eye-tracking research shows attention at the shelf doesn’t always turn into a sale9.
-
04
Private by design
Faces are blurred on the store’s own machine the moment a frame is read1. Only anonymous positions and counts leave the building. No footage, no faces, no identities, in line with Sri Lanka’s Personal Data Protection Act2.
- 1,200+hours of footage
- 94%counting accuracy
- 38shelf zones mapped
- 0faces stored
What the cameras saw
Half the store
was invisible
- 69%of shoppers never went past the second aisle. The back third of the store, where most high-margin and slow-moving lines sat, was close to dead space. Studies that tracked shopping carts found most shoppers never cover the whole store either8.
- 1 in 9shoppers who handled something at the promo stand by the door actually kept it. It had the longest dwell time in the store and almost no sales, a pattern well documented in shelf-attention research9.
- 2.4×per visit, shoppers doubled back in the middle aisles. The layout was confusing people, not the signs.
- 4 of 5trips were built around essentials like rice, dhal and sugar, which sat right by the entrance. People grabbed them and went straight to the till.
The margin model
Essentials pull, margins pay
In Sri Lanka many essentials sell under government price controls10, so rice, dhal and sugar earn almost nothing. They are also why people come in. We joined the camera data with the till data and margins for every line, the way consumer researchers combine shopping paths with purchases11, and designed the floor so the trip for essentials carries shoppers past the products that pay the bills.
- Price-controlled essentials
- High-margin lines
- Slow movers near expiry
- Typical shopper path
- Essentials to the back wall. The reason people visit now sits at the far end of the store, so every trip for rice passes everything else. Nearly half of supermarket purchases are unplanned, and what shoppers walk past shapes what they buy12.
- High margin on the loop. Snacks, personal care and ready-to-eat lines moved to eye level and end-caps along the path most shoppers now walk. Top and middle shelves win more attention9, and end-caps can multiply a product’s sales13.
- Slow movers into hot spots. Lines nearing their date rotate onto end-caps in the busiest zones, flagged by the system two weeks ahead, one of the most effective ways to cut retail food waste14.
- Fewer facings for “touch, don’t take”. Products people handled but rarely bought lost shelf space to lines that convert. More facings buy attention, so they belong where attention turns into sales9.
Results
Twelve weeks later
-
+3.6 pts
Higher gross margin
From 14.1% to 17.7% across the store, with essentials still sold at their controlled prices.
-
64%
Less stock thrown away
Slow movers now get in front of shoppers before their date, not after it.
-
+29%
High-margin sales
Snacks, personal care and ready-to-eat lines, now on the path instead of off it.
-
2.3×
Shoppers reaching the back
From 31% to 72% of visits, and baskets grew 17% on average.
And the extra lighting, signage refresh and two additional floor assistants were no longer needed. The cameras that solved it were already on the ceiling.
References
The research behind it
Every method on this page builds on published research, standards or official documentation. Numbers in the text point here.
- Ren, Z., Lee, Y. J., & Ryoo, M. S. (2018). Learning to anonymize faces for privacy preserving action detection. European Conference on Computer Vision (ECCV), 639–655. doi.org/10.1007/978-3-030-01246-5_38
- Parliament of Sri Lanka. (2022). Personal Data Protection Act, No. 9 of 2022 (as amended). www.dpa.gov.lk/guidelines.php
- Redmon, J., Divvala, S., Girshick, R., & Farhadi, A. (2016). You only look once: Unified, real-time object detection. IEEE Conference on Computer Vision and Pattern Recognition (CVPR), 779–788. doi.org/10.1109/CVPR.2016.91
- Jocher, G., & Qiu, J. (2024). Ultralytics YOLO11 (v11.0.0). Ultralytics documentation. docs.ultralytics.com/models/yolo11/
- Lin, T.-Y., Maire, M., Belongie, S., Hays, J., et al. (2014). Microsoft COCO: Common objects in context. European Conference on Computer Vision (ECCV), 740–755. doi.org/10.1007/978-3-319-10602-1_48
- Bernardin, K., & Stiefelhagen, R. (2008). Evaluating multiple object tracking performance: The CLEAR MOT metrics. EURASIP Journal on Image and Video Processing, 2008, 246309. doi.org/10.1155/2008/246309
- Zhang, Y., Sun, P., Jiang, Y., Yu, D., et al. (2022). ByteTrack: Multi-object tracking by associating every detection box. European Conference on Computer Vision (ECCV), 1–21. doi.org/10.1007/978-3-031-20047-2_1
- Larson, J. S., Bradlow, E. T., & Fader, P. S. (2005). An exploratory look at supermarket shopping paths. International Journal of Research in Marketing, 22(4), 395–414. doi.org/10.1016/j.ijresmar.2005.09.005
- Chandon, P., Hutchinson, J. W., Bradlow, E. T., & Young, S. H. (2009). Does in-store marketing work? Effects of the number and position of shelf facings on brand attention and evaluation at the point of purchase. Journal of Marketing, 73(6), 1–17. doi.org/10.1509/jmkg.73.6.1
- Parliament of Sri Lanka. (2003). Consumer Affairs Authority Act, No. 9 of 2003 (maximum retail price orders are issued under section 20(5)). www.ecolex.org/details/legislation/consumer-affairs-authority-act-no9-of-2003-lex-faoc204935/
- Hui, S. K., Bradlow, E. T., & Fader, P. S. (2009). Testing behavioral hypotheses using an integrated model of grocery store shopping path and purchase behavior. Journal of Consumer Research, 36(3), 478–493. doi.org/10.1086/599046
- Inman, J. J., Winer, R. S., & Ferraro, R. (2009). The interplay among category characteristics, customer characteristics, and customer activities on in-store decision making. Journal of Marketing, 73(5), 19–29. doi.org/10.1509/jmkg.73.5.19
- Tan, P. J., Corsi, A., Cohen, J., Sharp, A., et al. (2018). Assessing the sales effectiveness of differently located endcaps in a supermarket. Journal of Retailing and Consumer Services, 43, 200–208. doi.org/10.1016/j.jretconser.2018.03.015
- Buisman, M. E., Haijema, R., & Bloemhof-Ruwaard, J. M. (2019). Discounting and dynamic shelf life to reduce fresh food waste at retailers. International Journal of Production Economics, 209, 274–284. doi.org/10.1016/j.ijpe.2017.07.016
Your cameras are watching. Are you learning?
Tell us about your store. The first conversation about an AI, ERP or analytics project is free.