Work Case study · Computer vision
Every shelf is a survey
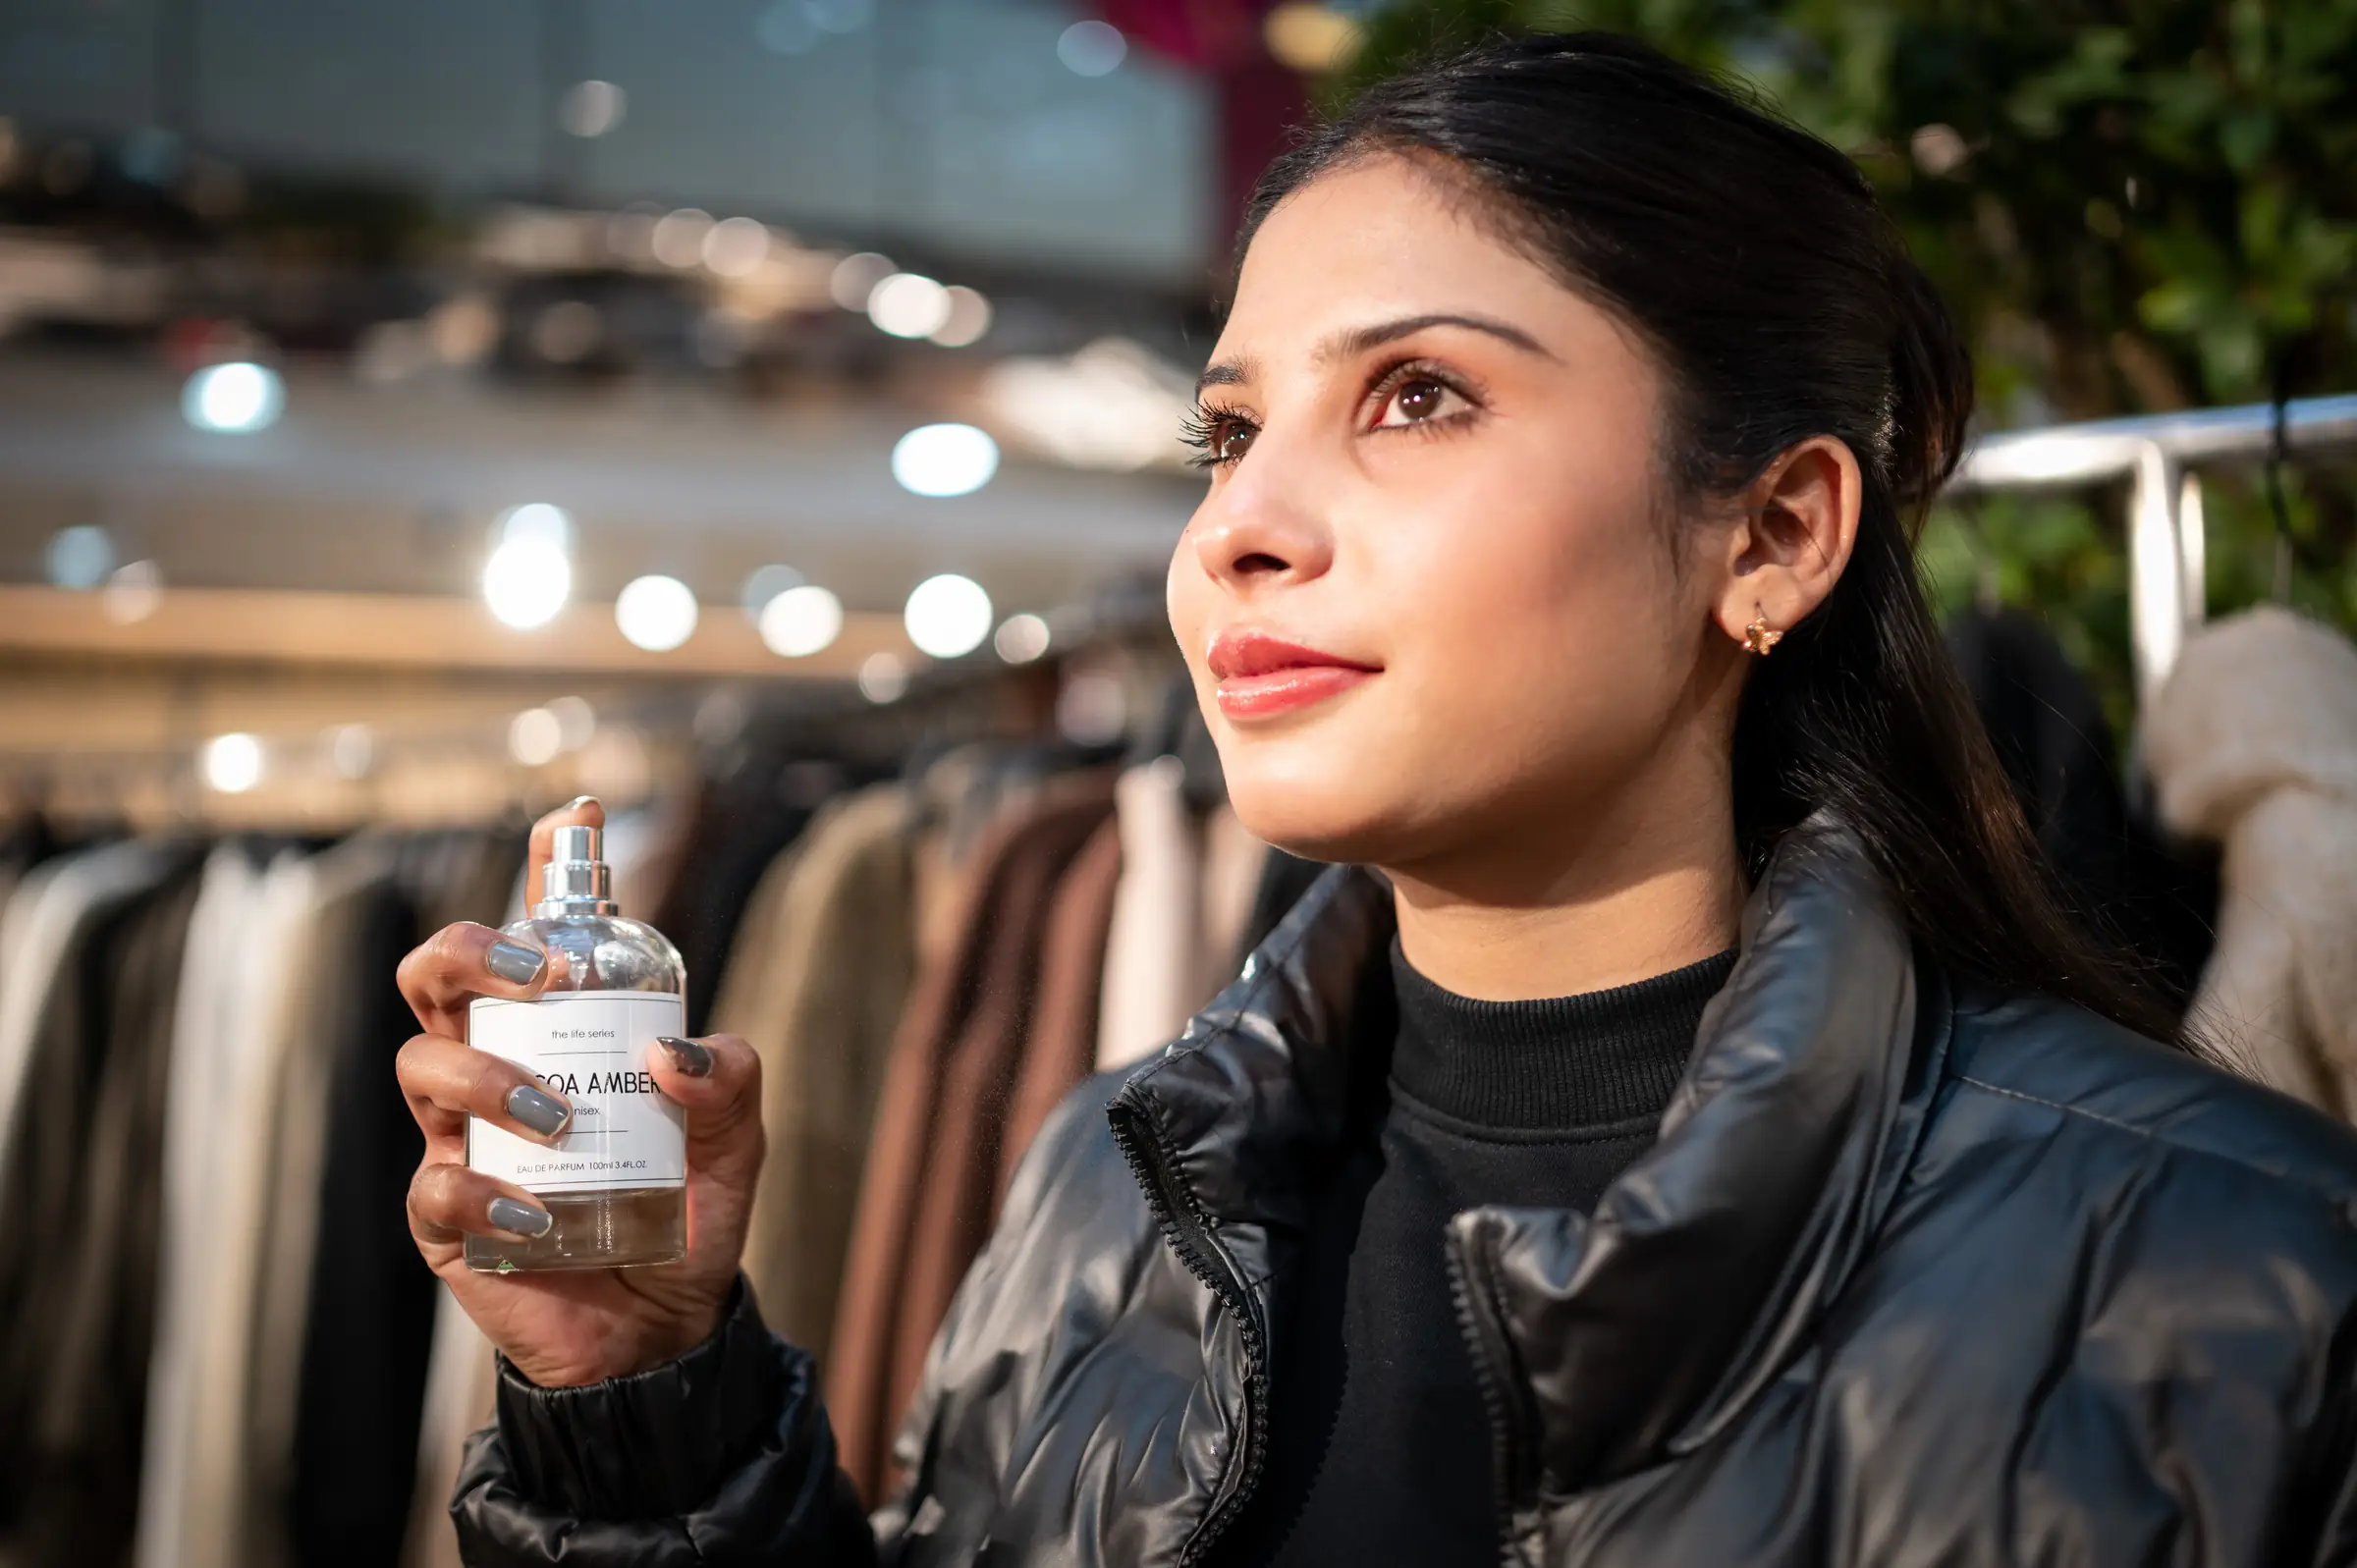
A beauty retailer was choosing what to stock from supplier pitches and customer questionnaires. We turned the cameras it already had into an always-on, anonymous study of what shoppers pick up, try, compare, put back and finally buy.
- −38%slow-moving stock
- +24%sell-through on new launches
- 11brands buying the insights
- 0faces stored
Where they started
What shoppers said, and what they did
The retailer runs six beauty stores and stocks dozens of brands. Range decisions came from two places: what suppliers pitched, and what customers said in surveys and focus groups. The surveys were confident. The tills disagreed.
That gap is old news to economists. What people choose reveals their preferences more reliably than what they say1. Asked directly, people give the answer that makes them look good2, and even honest intentions only partly predict what they actually do3. A shelf, on the other hand, never lies.
- Client
- Beauty and cosmetics retailer (name withheld)
- Scale
- 6 stores, around 4,000 products
- Cameras
- Existing ceiling cameras, no new hardware
- Timeline
- 12 weeks to the first monthly report
01 Reading the shelf
Hands, not faces
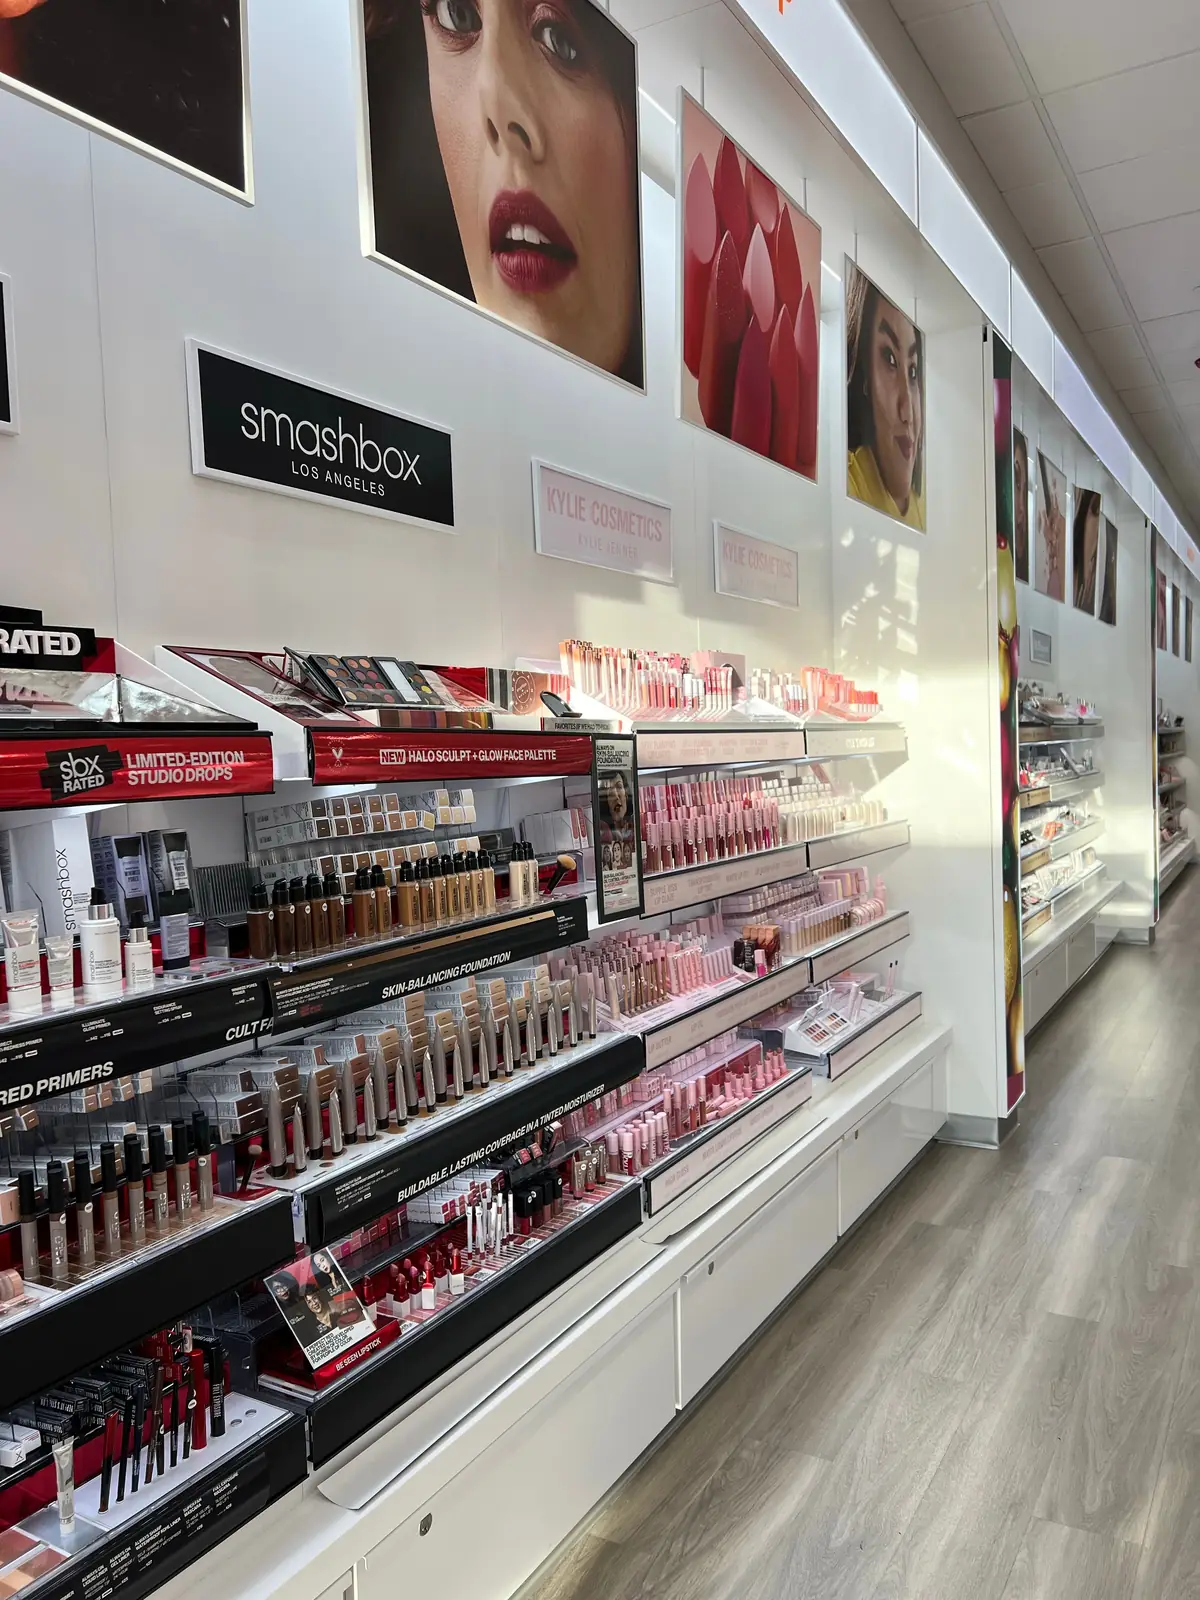
The system never looks at who a shopper is. It follows hands and arms using pose estimation, the same technique that lets software track body positions in real time4, and maps every shelf into zones, one per product.
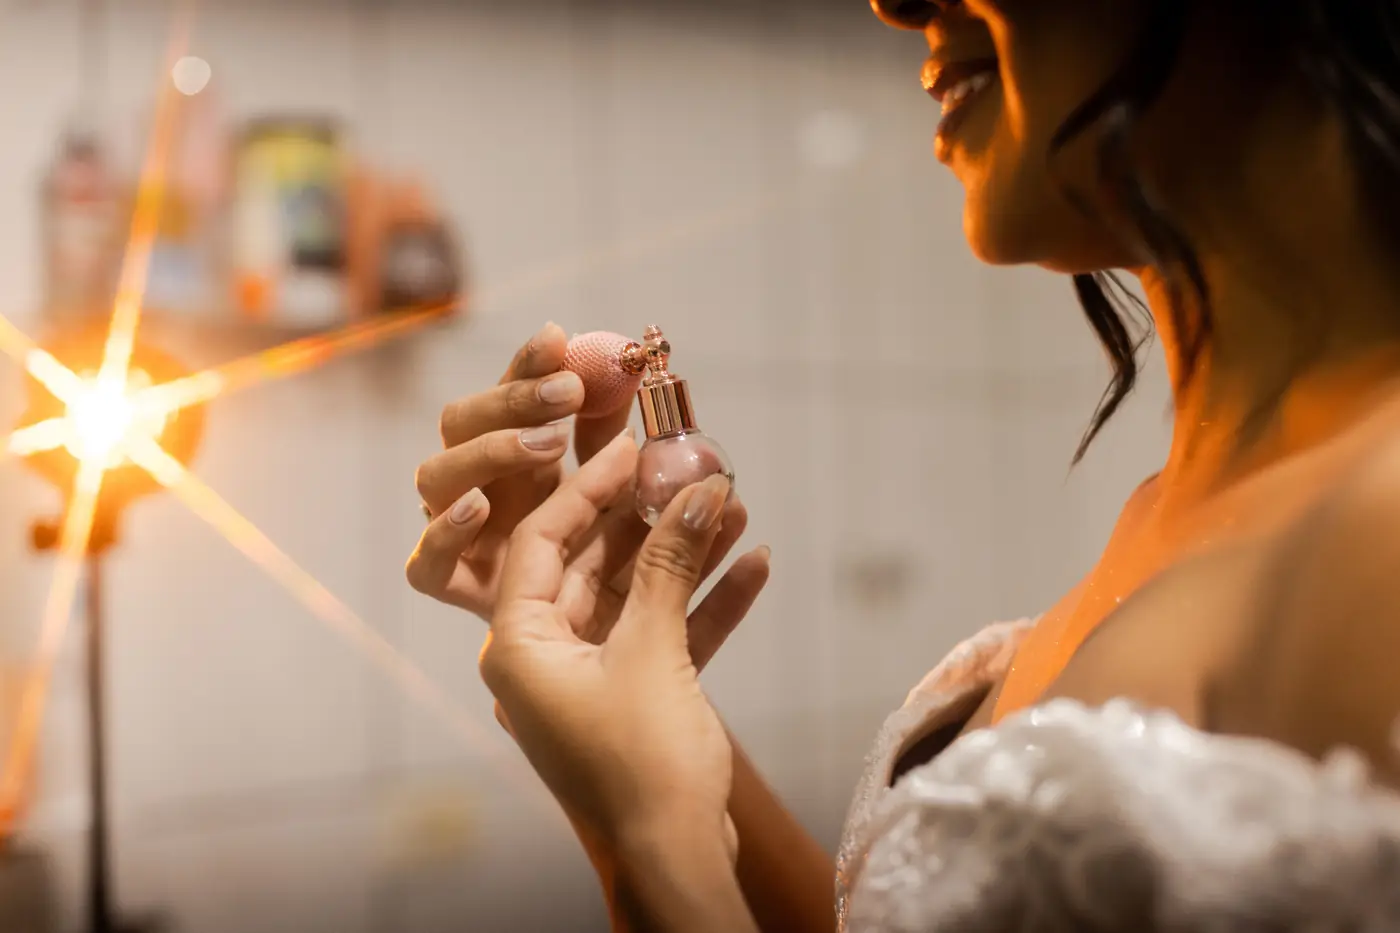
From that it recognises a handful of moments: a product picked up, tried on the back of a hand, compared with another, put back, or carried to the till. Researchers have shown shopper–shelf interactions like these can be recognised reliably from in-store cameras5. Touch matters here: being able to handle a product shapes how people judge it6, so a product that’s tried and then put back tells you something a sales report never will.
One aisle, one month
Choose a product.
See what shoppers did.
Every product on the shelf has a funnel: picked up, tried, put back, bought. Some products sell themselves. Some get tried and abandoned. And sometimes the strongest signal is a gap where a product should be.
Brighter = picked up more oftenOne aisle · one month
What shoppers did
Matte lipstick · Brick 07
Every interaction, counted anonymously by the cameras.
- Picked up 920
- Tried or tested 610
- Put back 520
- Bought 400
Tried often, put back often: shoppers like the idea more than the shade on their skin.
From store insight to market research
A study that runs
every day
-
01
Range decisions
Products that are picked up and rarely bought get fewer facings; products shoppers search the shelf for get more. Missing shades show up as a gap shoppers keep reaching into.
-
02
Launch testing
A new product goes on the shelf in two stores first. Within two weeks the funnel shows whether it’s being tried, compared and bought, before the big order is placed.
-
03
Packaging and placement
Move a product to eye level, change a tester, try a new pack, and measure what changes in shopper behaviour, not just in sales a month later.
-
04
Reports brands pay for
Each month, brands receive anonymous funnel data for their products against their category. For the retailer, the research became a new line of revenue.
Results
Two quarters in
- −38%
Slow-moving stock
Fewer products sitting untouched until they expire, as the range follows what shoppers actually reach for.
- +24%
Launch sell-through
New products tested on the shelf before full orders sell through faster.
- 2 shades
Added to the range
Both found as gaps shoppers kept reaching for; both sold out in their first week.
- 11
Brands subscribed
To the monthly shopper insights report, turning store data into research revenue.
References
The research behind it
Every method on this page builds on published research, standards or official documentation. Numbers in the text point here.
- Samuelson, P. A. (1948). Consumption theory in terms of revealed preference. Economica, 15(60), 243–253. doi.org/10.2307/2549561
- Fisher, R. J. (1993). Social desirability bias and the validity of indirect questioning. Journal of Consumer Research, 20(2), 303–315. doi.org/10.1086/209351
- Sheeran, P. (2002). Intention–behavior relations: A conceptual and empirical review. European Review of Social Psychology, 12(1), 1–36. doi.org/10.1080/14792772143000003
- Cao, Z., Hidalgo, G., Simon, T., Wei, S.-E., et al. (2021). OpenPose: Realtime multi-person 2D pose estimation using part affinity fields. IEEE Transactions on Pattern Analysis and Machine Intelligence, 43(1), 172–186. doi.org/10.1109/TPAMI.2019.2929257
- Liciotti, D., Contigiani, M., Frontoni, E., Mancini, A., et al. (2014). Shopper analytics: A customer activity recognition system using a distributed RGB-D camera network. Video Analytics for Audience Measurement (VAAM 2014), LNCS 8811, 146–157. doi.org/10.1007/978-3-319-12811-5_11
- Peck, J., & Childers, T. L. (2003). To have and to hold: The influence of haptic information on product judgments. Journal of Marketing, 67(2), 35–48. doi.org/10.1509/jmkg.67.2.35.18612
- Ren, Z., Lee, Y. J., & Ryoo, M. S. (2018). Learning to anonymize faces for privacy preserving action detection. European Conference on Computer Vision (ECCV), 639–655. doi.org/10.1007/978-3-030-01246-5_38
- Parliament of Sri Lanka. (2022). Personal Data Protection Act, No. 9 of 2022 (as amended). www.dpa.gov.lk/guidelines.php
What are your shelves telling you?
Tell us about your stores and cameras. The first conversation about computer vision and shopper research is free.