
Work Case study

Keeping a supermarket chain’s stock honest

A supermarket chain and wholesale business running on four systems that didn’t talk to each other. We put it all on one, down to a WhatsApp chat for the owner.

Where they started

Four systems and a lot of guesswork

The tills ran on an old point of sale that crashed during the evening rush. The agency that built it had gone quiet: no documentation, no support, no one to call. Accounts were kept in a SAP-based package, purchasing in a custom ERP, and stock in yet another system. Every evening someone re-typed the day’s figures from one into the next, and the owner still couldn’t say with confidence how a branch had done that day. It’s a common trap: research on retail operations has found inaccurate records and misplaced stock quietly costing stores more than 10% of profit, even with modern IT1.

The real cost was in fresh produce. Onions and potatoes arrive by the container. A thousand kilos never stays a thousand kilos: it loses water weight2, a few kilos go soft every day, and none of that shows up in the system. Miss it for a week and millions of rupees of stock can rot on the floor. Worldwide, roughly a third of all food produced is lost or wasted3.

  • Legacy POS, no vendor support
  • SAP-based accounting
  • Custom ERP for purchasing
  • Separate stock system
Client
Supermarket group and wholesale distributor (name withheld)
Scale
3 branches · 14 sales reps · 9 trucks
Timeline
11 months, in four stages
Languages
Sinhala and English, everywhere
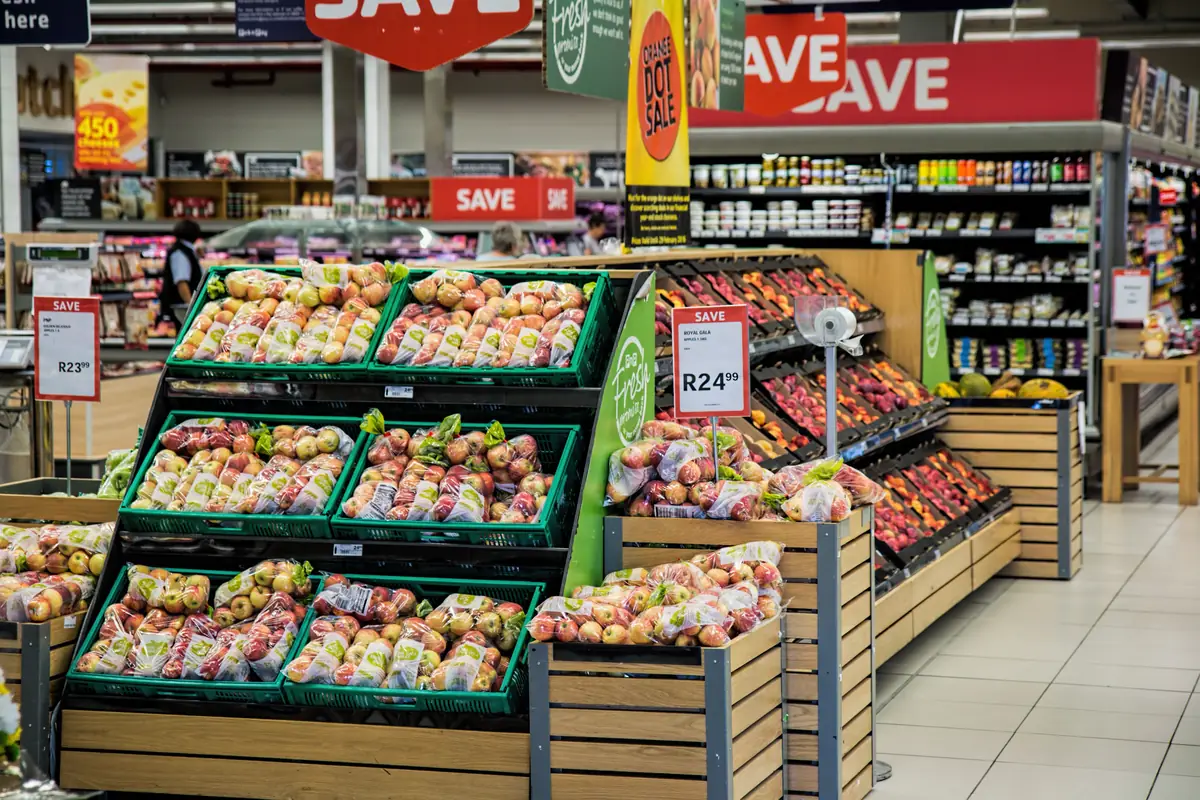
A supermarket produce section with crates of fresh vegetables and fruit

The system

How it all connects

Everything on the shop floor and on the road writes into one ERP. Everything the owner sees reads from it. Nobody re-types a figure between systems any more.

IN THE SHOPS AND ON THE ROADONE ERPFOR THE OWNERsalescountsordersdeliverieslive figuresclean historyanswersgoods inERPone set of clean dataStock & purchasingSales & invoicingCreditors & debtorsHR & payrollSinhala and English throughoutPoint of sale3 branches · tillsStock-count tablets2 per branch · dailySales-rep app14 reps · live stockLogistics9 trucks · loads, routesOwner dashboardbranches · stock · cashForecastingdemand per branchSuppliers
The point of sale in each branch, the stock-count tablets, the sales-rep app and the logistics dashboard send sales, counts, orders and deliveries into one ERP, which also records goods in from suppliers. The ERP covers stock and purchasing, sales and invoicing, creditors and debtors, and HR and payroll. It feeds the owner’s dashboard, the forecasting models and the WhatsApp assistant.

LiveToday, all branches

  1. Branch 1 tillSale · Rs 2,180 → Sales & invoicing
  2. Branch 3 tabletOnions · 212 kg → Stock & purchasing
  3. Rep 11Order #4820 → Sales & invoicing
  4. Owner on WhatsApp“Debtors over 60 days?” → Creditors & debtors
  5. LogisticsTruck 2 · loaded → Stock & purchasing
Sales today
1,284
Stock counts
27
Rep orders
63
WhatsApp questions
14

How we built it

Four stages,
starting at the tills

  1. 01Point of saleRebuilt with the cashiers
  2. 02ERP and stockTen items, counted every morning
  3. 03DistributionReps and trucks on live stock
  4. 04The owner’s viewDashboard, forecasts, WhatsApp

01 Point of sale

Rebuilt with the cashiers, not for them

We started at the tills. Before writing any code we stood behind cashiers during the evening rush, timed sales, and wrote down every moment they hesitated: hunting for produce codes, re-weighing, voiding a wrong item. Human-centred design starts with the people who use the system4.

We kept what they liked about the old system, like the layout of the produce keys, and dropped the rest. Then we built in two-week rounds and put each round in front of the same cashiers: small, repeated usability tests catch most problems early5. By launch the average sale took 58 seconds, down from 1 minute 34, and cashiers could switch between Sinhala and English at the till.

02 ERP and stock

Ten items, counted every morning

Growing the POS into an ERP was the hard part, and produce was the reason. You can’t ask staff to weigh every sack in the store every day, but if nobody does, the numbers drift. One study of nearly 370,000 inventory records at a major retailer found 65% of them were wrong6.

So each branch got two Android tablets. Every morning the system hands staff a short list, about ten items, to weigh and count: always the priority produce, plus a rotating set of other products. Research on inventory accuracy shows that counting the right items at the right time keeps records honest without full stock-takes7. It takes about twenty minutes. The counts go straight into the ERP, and the gap between recorded and real stock on priority produce fell from 9.2% to 1.6%. When onions start to age, the owner hears about it while they can still be moved to another branch or sold.

03 Distribution

Reps and trucks on live stock

The wholesale side runs out of a warehouse that supplies shops across the region. Before, a rep could take an order for stock that had already gone out on another truck, and nobody found out until the delivery came up short.

Now fourteen sales reps carry an app with live warehouse stock, so an order taken in a shop is an order that can be filled. Orders land on a logistics dashboard where the team loads nine trucks, plans routes and books returns when they come back.

Order 4821 · Sunrise Stores

  • Big onions50 kgIn stock
  • Samba rice 5 kg20In stock
  • Coconut oil 1 L3624 left

Truck 4Thursday

04 The owner’s view

The whole business on one screen

For the first time the owner could see every branch side by side: today’s sales against forecast, stock reports, creditors and debtors, what suppliers delivered and what went out on the trucks, and payroll for every branch.

None of it is a separate report someone has to prepare. It reads from the same ERP the cashiers, store staff and reps are working in, so it is current to the last sale.

Forecasting

Six months of clean data before a single prediction

The owner wanted to know how much stock each branch would need before it ran short. The catch was that years of history from the old POS couldn’t be trusted: duplicated sales, missing days, items filed under the wrong codes.

So we didn’t start with the model. Google researchers call this a data cascade: problems in the data compound through everything built on top of it8. We cleaned what we could from the old records, then ran the new POS for six months to see what correct data from this business actually looks like. Comparing the two showed us exactly where the old data was wrong, so we could fix it and join the two histories together. Only then did we train the machine learning models that forecast sales and stock per branch, the kind of approach that beat traditional statistical methods on Walmart’s sales data in the M5 forecasting competition9, measured with standard forecast-accuracy checks10.

  • 2.4Mold POS transactions cleaned
  • 6 monthsof new POS data as the benchmark
  • 91%weekly forecast accuracy per branch

The agent

He asks the business
on WhatsApp

The owner spends his day on the shop floor and in the warehouse, not at a desk. Opening a dashboard to check one number wasn’t going to happen. So we connected an assistant to his WhatsApp through Meta’s official Business Platform11.

He sends a message the way he’d ask his accountant, and the assistant looks the answer up in the live system instead of guessing12,13: how a branch is doing, where creditors stand, which cheques clear today or this week. He sends it around twenty questions a day, and the answers always match what the team sees on the dashboard, because they come from the same ERP.

Results

A year on

  • 38%

    Faster at the till

    An average sale went from 1 minute 34 to 58 seconds, so the evening queues move.

  • 41%

    Less produce thrown away

    Daily counts and forecasts mean onions and potatoes get moved or sold before they go bad.

  • 1.6%

    Stock that matches the shelf

    The gap between recorded and real stock on priority produce, down from 9.2%, even as it loses weight.

  • 31%

    Lower back-office costs

    No more re-typing figures between systems or full-store stock counts.

References

The research behind it

Every method on this page builds on published research, standards or official documentation. Numbers in the text point here.

  1. Raman, A., DeHoratius, N., & Ton, Z. (2001). Execution: The missing link in retail operations. California Management Review, 43(3), 136–152. doi.org/10.2307/41166093
  2. Ward, C. M. (1976). The influence of temperature on weight loss from stored onion bulbs due to desiccation, respiration and sprouting. Annals of Applied Biology, 83(1), 149–155. doi.org/10.1111/j.1744-7348.1976.tb01703.x
  3. FAO. (2011). Global food losses and food waste: Extent, causes and prevention. Food and Agriculture Organization of the United Nations, Rome. www.fao.org/4/mb060e/mb060e.pdf
  4. International Organization for Standardization. (2019). ISO 9241-210:2019 Ergonomics of human-system interaction, Part 210: Human-centred design for interactive systems. www.iso.org/standard/77520.html
  5. Nielsen, J. (2000). Why you only need to test with 5 users. Nielsen Norman Group. www.nngroup.com/articles/why-you-only-need-to-test-with-5-users/
  6. DeHoratius, N., & Raman, A. (2008). Inventory record inaccuracy: An empirical analysis. Management Science, 54(4), 627–641. doi.org/10.1287/mnsc.1070.0789
  7. Kök, A. G., & Shang, K. H. (2007). Inspection and replenishment policies for systems with inventory record inaccuracy. Manufacturing & Service Operations Management, 9(2), 185–205. doi.org/10.1287/msom.1060.0136
  8. Sambasivan, N., Kapania, S., Highfill, H., Akrong, D., et al. (2021). “Everyone wants to do the model work, not the data work”: Data cascades in high-stakes AI. ACM CHI Conference on Human Factors in Computing Systems, 1–15. doi.org/10.1145/3411764.3445518
  9. Makridakis, S., Spiliotis, E., & Assimakopoulos, V. (2022). M5 accuracy competition: Results, findings, and conclusions. International Journal of Forecasting, 38(4), 1346–1364. doi.org/10.1016/j.ijforecast.2021.11.013
  10. Hyndman, R. J., & Athanasopoulos, G. (2021). Forecasting: Principles and practice (3rd ed.). OTexts. otexts.com/fpp3/
  11. Meta. WhatsApp Business Platform: Cloud API developer documentation. developers.facebook.com/docs/whatsapp/cloud-api/
  12. Yao, S., Zhao, J., Yu, D., Du, N., et al. (2023). ReAct: Synergizing reasoning and acting in language models. International Conference on Learning Representations (ICLR). doi.org/10.48550/arXiv.2210.03629
  13. Schluntz, E., & Zhang, B. (2024). Building effective agents. Anthropic Engineering. www.anthropic.com/engineering/building-effective-agents

Running on disconnected systems?

Tell us how your business runs today. The first conversation about an ERP, dashboard or AI agent project is free.